Once again, energy giant BP is back with its Statistical Review of World Energy, probably the most comprehensive data source for energy-related issues available today.
Now in its amazing 61st year, published each June, the document reviews both overall energy issues as well as drilling down into individual energy sources (oil, natural gas, coal, nuclear, hydro-electric and renewables).
The report says that global energy consumption grew by 2.5% in 2011, broadly in line with the historical average but well below the 5.1% seen in 2010. Once again emerging economies accounted for all of the net growth in energy consumption, with demand in the developed (OECD) falling for a third time in the last four years, falling .8%, partly reflective of overall weak economic growth in many OECD countries and recession in parts of Europe. Consumption increased 5.3% in emerging markets, close to its 10-year average.
That means that “The center of gravity for world energy consumption continues to shift from the OECD to emerging economies, especially in Asia,” the report says. This is especially interesting to us relative to greenhouse gas emissions.
Amazingly, China accounted for 71% of the total increase in global energy consumption.
The report offers a sort of mixed perspective relative to “Peak Oil,” noting that “The world is not structurally short of hydrocarbon resources – as our data on proved reserves confirms year after year – but long lead times and various forms of access constraints in some regions continue to create challenges for the ability of supply to meet demand growth at reasonable prices.”
Note that hydrocarbons would include natural gas, however, and that it also indicates the era of “cheap oil” may be gone even if oil itself is around for years, as newer sources are just much more expensive to develop and extract.
Renewable energies (solar, bio-fuels, etc.) are growing but still represent just 2% of total energy consumption. The reality is that number is not likely to reach significant levels for many, many years.
Oil Still Top Energy Source, but Declining
Oil remains the world’s leading fuel, at 33.1% of global energy consumption, but oil continued to lose market share for the twelfth consecutive year and its current share is the lowest since BP started to track this metric in 1965.
Conversely, coal’s market share of 30.3% was the highest since 1969, following growth in consumption of 5.4% last year.
The relative shares of global consumption by the different energy sources over time is shown in the figure below.
Global Energy Consumption by Source Type
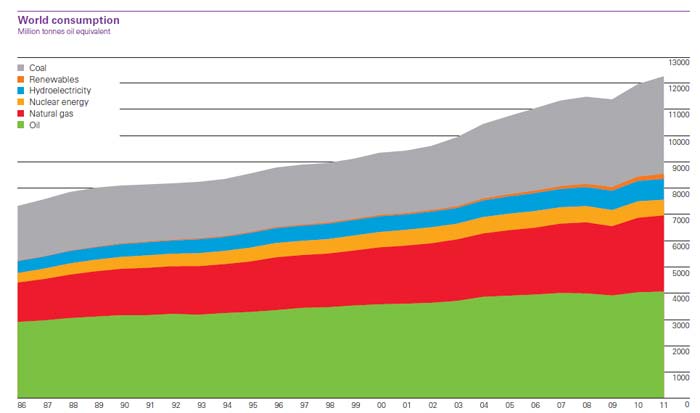
Source: BP
Global oil consumption grew by a below-average 0.6 million barrels per day (b/d), or 0.7%, to reach 88 million b/d. This was once again the weakest global growth rate among fossil fuels.
That slow growth was probably in part due to very high prices, as perhaps surprising to some, oil prices hit record levels for the full year, even higher than 2008 on average.
Average oil prices for the year exceeded $100 for the first time ever (in money-of-the-day terms) and inflation-adjusted prices were the second-highest on record, behind only 1864. Brent crude oil, which is what most of the world pays (versus West Texas Crude pricing in the US), averaged $111.26 per barrel in 2011, an increase of 40% from the 2010 level.
US oil production was up, but at just 285,000 barrels per day not enough to make a big impact domestically or globally, though that was the highest production level since 1998. All told, the US produced about 8.8% of the world’s oil in 2011 – while consuming about 20.5% of the total.
Each year, we are interested in looking at data relative to the "reserves to production" levels for oil. In other words, are the “proven” reserves rising or declining relative to how much oil is being produced? Peak Oil would say the number will start declining.
As shown in the chart below, the ratio is rising (the gray line) on a global basis. But more worrisome may be that it continues to fall in the Middle East, still the dominant source for world oil, and that most of the global increase is due to the huge run up of reserves claimed by Venezuela. Is that data accurate? That is a questionable proposition, according to some sources.
Reserves to Production Ratios by Region
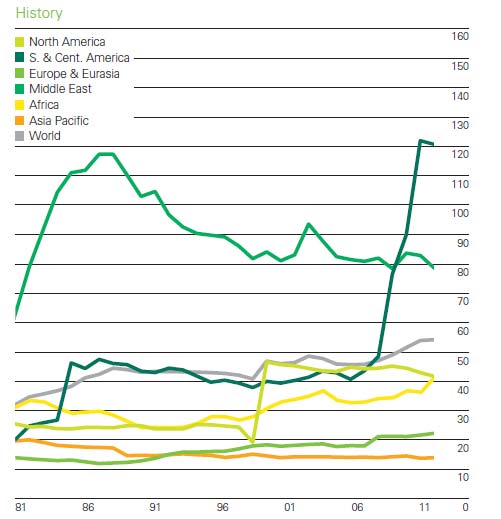
Source: BP
Renewable energy sources saw mixed results in 2011, the report says. Global biofuels production stagnated, rising by just 0.7% or 10,000 barrels per day oil equivalent (b/doe), the weakest annual growth since 2000, for example.
In contrast, renewable energy used in power generation grew by an above-average 17.7%, driven by continued robust growth in wind energy (+25.8%), which accounted for more than half of renewable power generation for the first time. Solar power generation grew very rapidly (+86.3%), but from a smaller base.
All told, the share of consumption for renewables has tripled from .7% in 2001 to 2.1% in 2011.
Unlike some past reports, there is not much this year in terms of numbers relative to greenhouse gas emissions. However, the positive overall growth in energy consumption and the especially strong growth rate for coal certainly means that GHG emissions rose in 2011.
The full report and more is available here: 2012 BP Statistical Review of World Energy
Any reaction to this year's BP report? What data surprised you? Let us know your thoughts at the F eedback button below.

TheGreenSupplyChain.com is now Twittering! Follow us at www.twitter.com/greenscm |

