As usual in June, BP released its annual Statistical Review of World for Energy 2017.The review is a sort of almanac of all matter of energy related data, now in its 66th year, and as always it is quite an interesting and educational read.
The headline news is that global primary energy consumption increased by just 1.0% in 2016, similar to the below-average growth recorded in 2015 (0.9%) and well below the 10-year average of 1.8%, as BP says we are in a "period of transition" in energy markets.
By contrast, world GDP grew at about 3.1% in 2016, according to the International Monetary Fund's estimate, so energy consumption grew only about one-third the pace of economic growth. tHowever, the report notes there was a global slowdown in industrial production IN 2016, the most energy-intensive sector of the economy.
But at the end of the day, big gains in energy efficiency are driving the reduction in energy consumption, the report says, noting that energy intensity - the average amount of energy
needed to produce a unit of GDP - fell in 2016 at
historically unprecedented rates.
As was the case in 2015, growth was below
average in all regions except Europe and Eurasia. Emerging economies accounted for almost all of the increase in global energy consumption, with about half coming from China and India alone.
However, even in China, energy consumption grew by just 1.3% in 2016 - only about 25% of its 10-year average. Growth during 2015 and 2016
was the lowest over a two-year period since
1997-98. Energy consumption in India grew much faster in 2016, hwever, at 5.4%.
BP notes that this brake in China's energy consumption
partly reflects the gradual slowing in economic
growth, but it has been greatly compounded by
pronounced weakness in China's most energ-yintensive
sectors, particularly iron, steel and
cement, which together account for around
a quarter of China's total energy consumption.
Despite this, China remained the
world's largest growth market for energy for
a 16th consecutive year.
Overall, OECD countries saw a small increase in consumption (0.2%), with growth in Europe offsetting declines in the US and Japan, but all three regions were basically flat in 2016.
Emerging economies now account for 58.4% of global energy consumption, up a few ticks from 2015. However, growth in these countries of 1.7% was well below its 10-year average of 3.7%.
With the slow growth of energy consumption, CO2 emissions followed suit, rising just 0.1% as a result of energy consumption. During
2014-16, average emissions growth has
been the lowest over any three-year period
since the largely recession years of 1981-83.
By fuel, price of Brent oil price averaged $43.73
per barrel in 2016, down from $52.39 per
barrel in 2015 and its lowest (nominal) annual
level since 2004.
Oil remained the world's leading fuel,
accounting for a third of global energy
consumption, and with the low prices driving an increase in oil's global market share
for the second year in a row, following 15 years
of declines from 1999 to 2014.
The low prices led to an decline in US oil production of 400,000 barrels per day on average, or a drop of 3.2%. That said, the 10-year growth average growth in production has been 6.3%, and the US in 2016 contributed 13.4% of total global oil production.
World natural gas consumption grew by
63 billion cubic metres (bcm) or 1.5%, slower
than the 10-year average of 2.3%, led by rapid growth in European consumption.
Natural gas prices fell in all regions, with the US benchmark Henry Hub down yet again, falling 5% after a sharp decline in 2015, while European and Asian gas
markets were down 20-30% as prices continued
to adjust to increased LNG supplies.
Perhaps the most striking feature across the
different fuels was the continuing rapid descent of
coal, with consumption (-1.7%) falling
sharply for the second consecutive year and the
share of coal within primary energy declining to its
lowest level since 2004.
The turnaround in the fortunes of coal over
the past few years is stark: it is only four years
ago that coal was the largest source of energy
demand growth. There may be further ups and
downs in the fortunes of coal over coming years,
but the weakness in recent years does seem to
signal a fairly decisive break from the past.
Global nuclear power generation increased by
1.3% in 2016. China accounted
for all of the net growth, expanding by 24.5%.
Renewable power (excluding hydro) grew by
14.1% in 2016, below the 10-year average, but
the largest absolute increase on record. Although
the share of renewable power within primary
energy edged up only slightly to 3.2%, its strong
growth meant it accounted for over 30% of the
increase in primary energy consumption.
China continued to dominate renewables growth,
contributing over 40% of the global increase - more
than the entire OECD - and surpassing the US to
become the largest producer of renewable power. That said, US renewable energy represented a strong 20% of total global consumption.
Wind power generation grew 15.6% in 2016, while solor power generation grew a very rapid 29.6% globally.
However, global biofuels production grew by just 2.6%, well below the 10-year average of 14.1%.
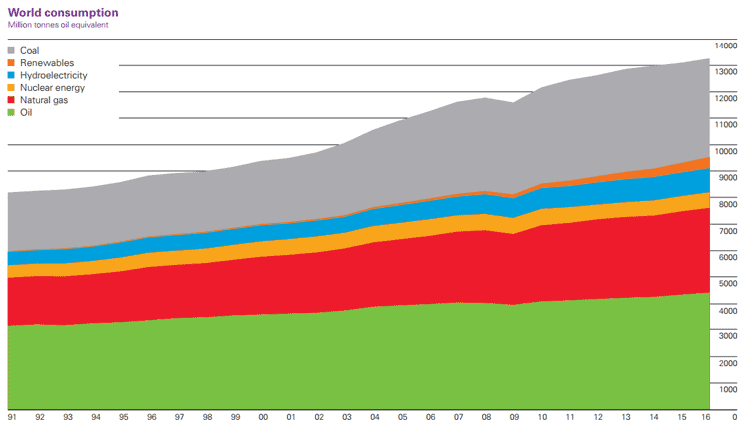
A chart showing global energy consumption by fuel source over time is shown below:

Source: BP
There's a lot more, and we encourage you to take a look at the report, which is available here: BP Statistical Review of World Energy 2017
Good job by the experts at BP again this year
Any reaction to this year's BP report? Let us know your thoughts at the Feedback button below.

|