Whether there really is man-made global warming is of course beyond critical in green supply chain thinking. The extensive efforts to reduce carbon emissions by companies across the globe, government actions such as cap and trade regimes in much of Europe and California, potential "carbon taxes" on ocean shipping announced by the EU last week, and much more all rest on some combination of theories and evidence that such greenhouse gas emission are and will cause global temperatures to rise.
So are global temperatures continuing to rise?
A controversy of sorts on this topic started this week, when British tabloid paper The Daily Mail took just published data from United Kingdom’s National Weather Service on average global temperatures, which appear to show that the earth has seen temperatures remain pretty constant over the 16 years, as shown in the chart below.
"The figures, which have triggered debate among climate scientists, reveal that from the beginning of 1997 until August 2012, there was no discernible rise in aggregate global temperatures," wrote the Daily Mail. "This means that the plateau or pause in global warming has now lasted for about the same time as the previous period when temperatures rose, 1980 to 1996. Before that, temperatures had been stable or declining for about 40 years."
However, many climate scientists called the report and chart misleading, saying it was too short of a period from which to draw any conclusions, and that even if this is a pause, the overall temperature trend remains strongly up.
"As we've stressed before, choosing a starting or end point on short-term scales can be very misleading," said a blog in response to the Daily Mail article by the Met Office, the UK's National Weather Service. "Climate change can only be detected from multi-decadal timescales due to the inherent variability in the climate system. If you use a longer period the trend looks very different."
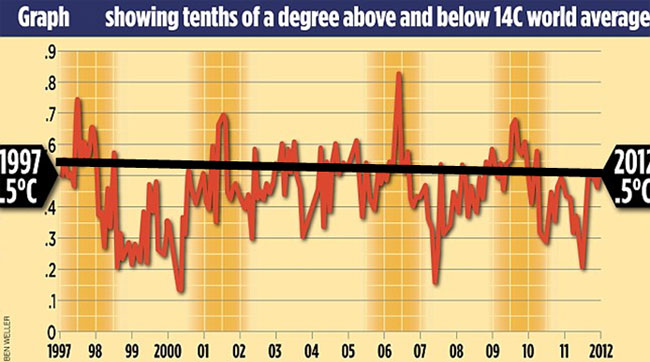
Source: Daily Mail, from UK Weather Service Data
The Met Office added that global surface temperatures over the last 140 years have risen by about .8 degrees centigrade. However, within this timeframe there have been several periods lasting a decade or more during which temperatures have risen very slowly or cooled.
"The current period of reduced warming is not unprecedented and 15-year long periods are not unusual," the blog added.
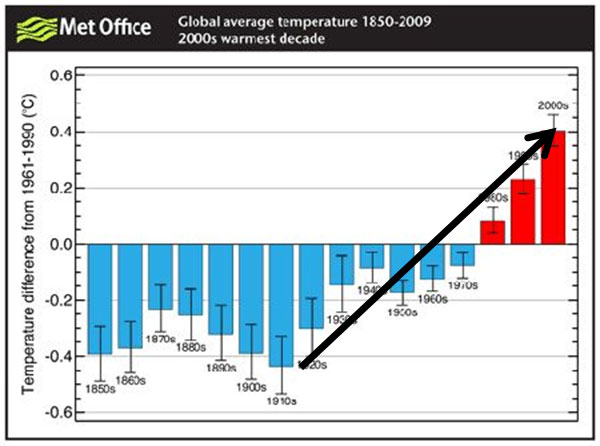
The Met Office further stated that "Eight of the top ten warmest years have occurred in the last decade."
Does that last statement really jive with the first chart on the temperatures over the last 16 years? We ae scratching our heads a little bit on that one.
Below is a graphic presented by the Met Office showing changes in average global temperatures from 1850 to 2009 by decade, using 1960-1990 as the baseline from which the change is calculated. Obviously with this data, temperatures appear to be on the march fro the 1910s through the first decade of this century, though we will note the way the scale presented migth appear to exaggerate the absolute level of change.
So, recent trend reversal, or irrelevant blip in the overall trend? We'll just keep presenting the data.
Any reaction to this recent data? Was it used out of context? Let us know your thoughts at the Feedback button below.

|

